
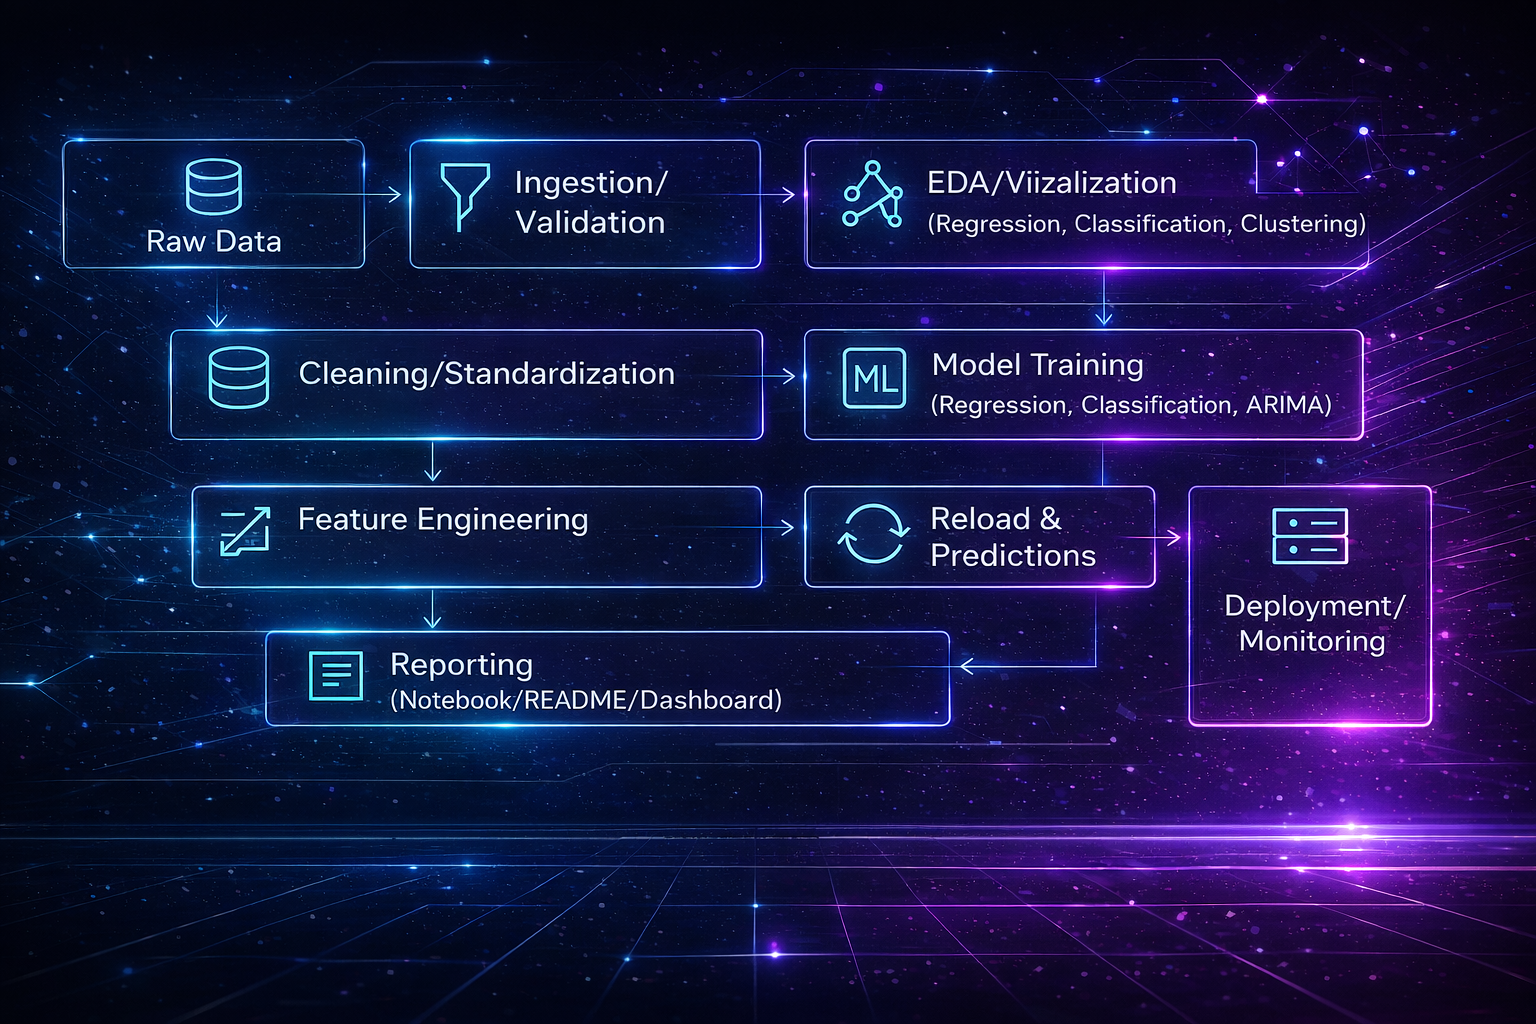
These visuals represent the core story of esports economics, audience behavior, and predictive intelligence.
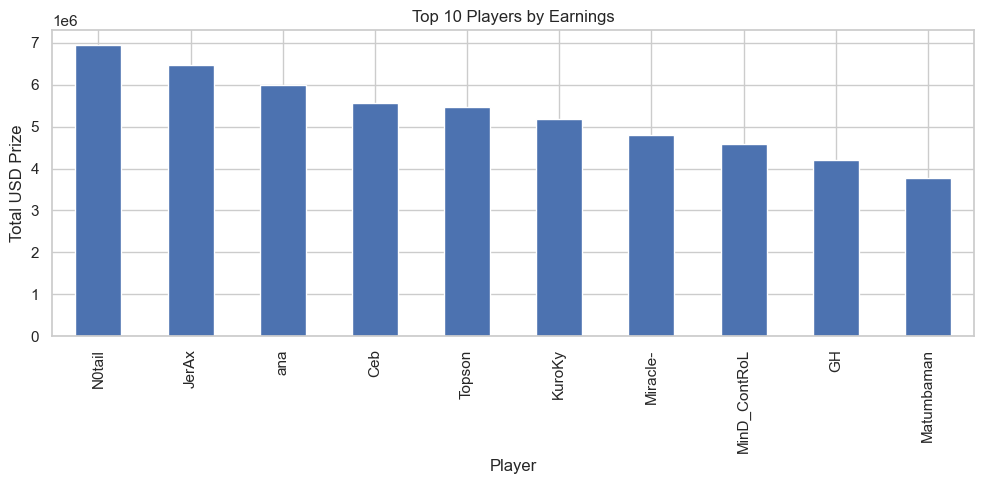
1️⃣ Top Games by Player Earnings
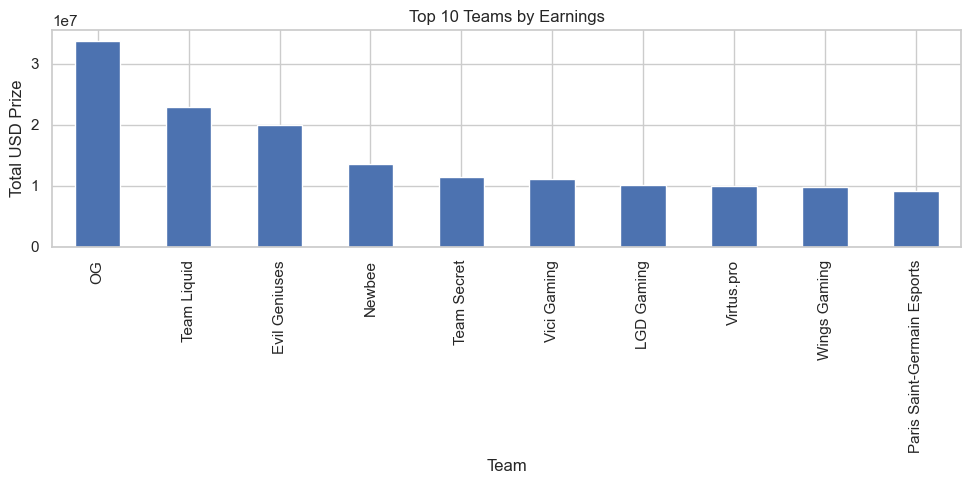
2️⃣ Top Games by Team Earnings
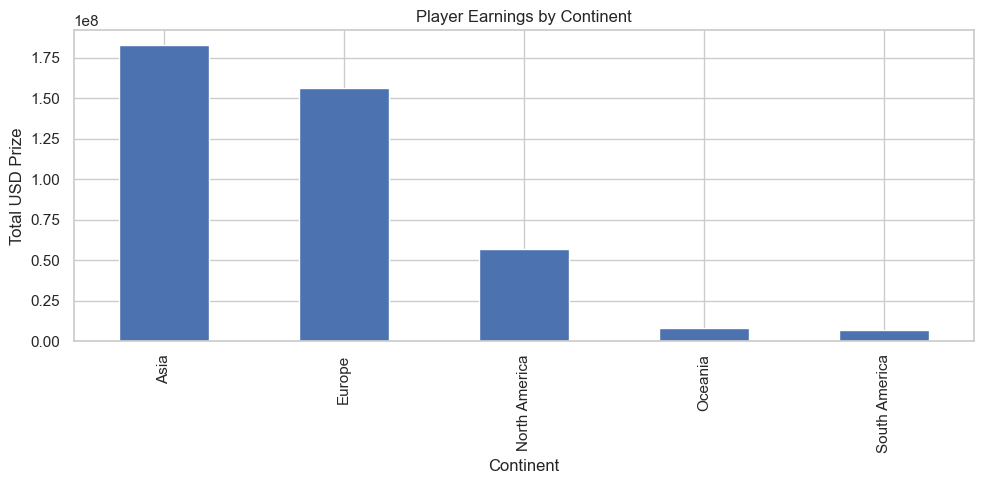
3️⃣ Continent Share of Player Earnings
4️⃣ Esports Revenue Growth (2020–2025)
.png)
5️⃣ Esports Audience Growth (2020–2025)
.png)
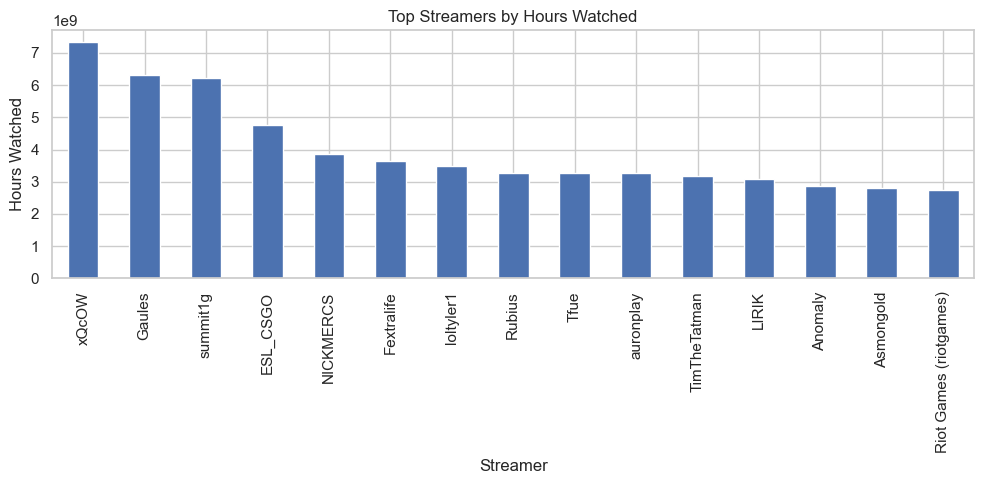
6️⃣ Top Streamers by Hours Watched
.png)
7️⃣ Average vs Peak Viewers (Twitch Games)
%20prize%20vs.%20tournaments.png)
8️⃣ Team Performance Clusters (K-Means)
All insights are included in the notebook only the essential visuals appear in the README.
-- Player & Team Ecosystem
✔ Earnings distribution (KDE + histogram)
✔ Genre-based financial analysis
✔ Inequality metrics (skewness, kurtosis)
-- Geographic & Market Intelligence
✔ Continent share of earnings
✔ Regional revenue & audience trends
✔ Country-level esports performance
-- Twitch Ecosystem Analysis
✔ Distribution of followers & viewers
✔ Partner vs non-partner statistical difference (Welch t-test)
✔ Average vs peak viewer correlations
✔ Top streamers and top game categories
-- Advanced Statistical Analysis
✔ QQ plots for normality checks
✔ Outlier detection (z-score)
✔ Variance, skewness, kurtosis metrics
-- Machine Learning Models
✔ Popularity Tier Classifier (Accuracy: 0.89)
✔ Confusion Matrix
✔ K-Means Team Segmentation
-- Time Series Forecasting (2026–2030)
✔ ARIMA forecast for gaming revenue
✔ Confidence intervals
✔ Forecast volatility analysis
-- Esports Economy (Players & Teams)
| Metric | Value |
|---|---|
| Player Earnings Skewness | 4.83 |
| Team Earnings Skewness | 10.22 |
| Player Earnings Variance | Very High |
| Team Prize Inequality | Extremely High |
-- Esports Market Growth (2020–2025)
| Metric | Value |
|---|---|
| Revenue CAGR | 0.30% |
| Audience CAGR | 0.87% |
-- Twitch Ecosystem Insights
| Insight | Value |
|---|---|
| Welch t-test (partner vs non-partner) | p = 0.0306 (significant) |
| Streamer outliers | z - value missing |
-- Popularity Tier Classifier
-
Accuracy: 0.89
-
High Tier Recall: 0.87
-
Low Tier Recall: 0.95
-
Medium Tier Recall: 0.83
-- Team Clustering (K-Means)
-
Clusters show separation based on:
-
Prize pool dominance
-
Tournament activity volume
| Year | Forecasted Revenue (Billion USD) |
|---|---|
| 2026 | 93.14 |
| 2027 | 91.89 |
| 2028 | 92.07 |
| 2029 | 92.04 |
| 2030 | 92.05 |
Confidence Interval Range: −15.7B to 199.8B (High Volatility)
pip install -r requirements.txt
jupyter notebook esports_analysis_code.ipynb
-
Esports prize pools are extremely top-heavy — inequality dominates.
-
Asia & Europe lead in both player earnings and market revenue.
-
Twitch creator ecosystem shows strong top-1% dominance.
-
Partnered streamers have statistically higher viewership.
-
Forecasting suggests stable but slow growth with high uncertainty.
-
ML models provide segmentation & prediction useful for esports orgs.